






Higher resolution, better sensitivity, and excellent reproducibility: this is how Dynamic Image Analysis (DIA) improves the characterization of powders and granulates in both quality control and R&D. This white paper outlines how particle size distribution and particle shape are determined by DIA, illustrated by application examples from the pharmaceutical industry which prove the superiority of the method over sieve analysis and laser diffraction.
Traditional techniques for particle size distribution analysis of pharmaceutical samples are sieve analysis, microscopy or laser diffraction. These methods are established in pharmacopoeia and are used in pharmaceutical laboratories all over the world.
With the introduction of Dynamic Image Analysis (DIA) as an alternative method, it is now possible to measure particle size and shape of powders, granulates, pellets and suspensions of particles > 1 μm. A number of trials clearly demonstrate the advantages of DIA compared to the traditional particle sizing methods. Many pharmaceutical companies have already recognized the potential of this method and added this technology to their research and quality control labs. Typical application examples are:
- Micronized active ingredients (APIs) and excipients
- Pharmaceutical granulates (e. g. tableting mixtures)
- Size and shape of pellets
- Monitoring of coating processes
- Characterization of crystalline APIs and excipients
The principle of Dynamic Image Analysis (DIA)
Just like microscopes, DIA analyzers consist of an illumination unit, objective lenses and a camera system. Particles are usually detected in transmitted light and the images contain shadow projections of the particles. Unlike microscopy however, the objective of DIA is the detection and evaluation a vast number of particles in a very short analysis time. This is achieved by generating a flow of particles which is photographed by high-speed cameras (Fig. 1). The particle flow can be in free fall for pourable solids, in an air flow generated by a Venturi nozzle for agglomerated powders, or even in a liquid suspension. Depending on the instrument and the application, between 60 and 320 images are acquired and evaluated in real time!
An automated microscope will typically need 30-60 minutes to capture enough particles to calculate a meaningful size distribution. DIA systems evaluate some hundreds of thousands or even millions of particles within a few minutes. The resulting size distribution is therefore based on a much larger basis, eliminating errors arising from sampling and poor statistics. Additionally, the measurement range of a DIA system is more than 10 times larger than that of a microscope - a significant advantage as many samples contain particles from the micron to the millimeter range.
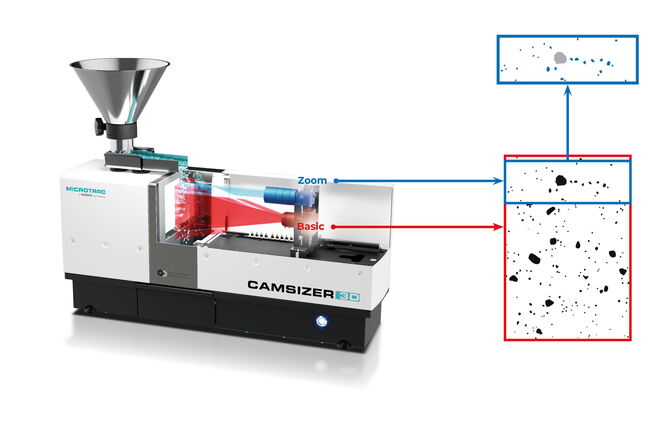
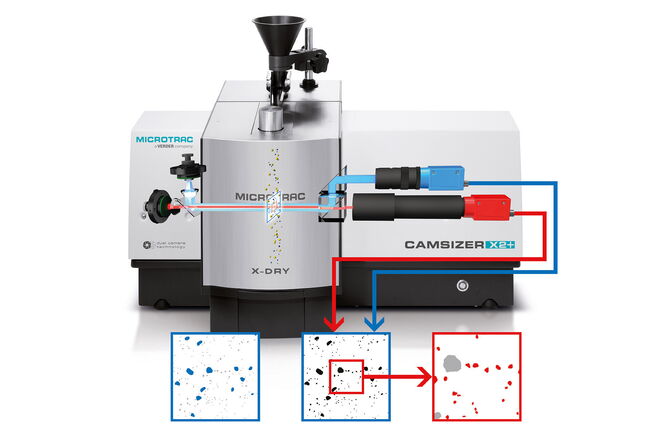
Fig. 1 Two state-of-the-art DIA instruments: CAMSIZER 3D (left) and CAMSIZER X2+ (right). The CAMSIZER 3D is optimized for the fast analysis of pourable bulk materials in the size range from 20 μm to 30 mm, while the X2+ model operates in the size range from 0.9 μm to 8 mm. The CAMSIZER X2+ offers several sample dispersion options, such as an air jet nozzle with adjustable pressure and a wet dispersion unit.
Image Analysis: What you see is what you get!
Imaging techniques provide a direct approach to particle size analysis. The basic idea is simple: "What you see is what you get". Based on pictures of individual particles, automatic software algorithms determine size and morphology. Particle length and particle width are directly accessible, as shown in Fig. 2. This shows the versatility of DIA, particularly in combination with shape analysis which runs simultaneously to the size measurement. Some shape parameters are explained in Fig. 3.
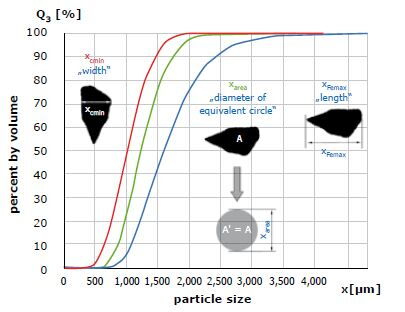
Fig. 2 Selection of basic size parameters used in image analysis. The size distributions are based on width (red), length (blue) or equal area diameter (green).
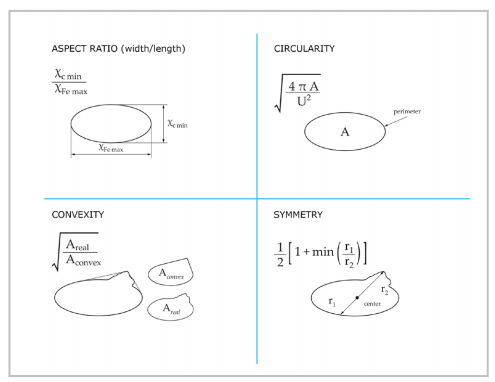
Fig. 3 Selection of basic shape parameters used in image analysis.
Calculation of the AFS number. Note that the AFS number can only be calculated, if the correct size classes have been used. The selected sieves must be a contiguous subset of the ASTM mesh sieve series.
Voorbeelden
Example 1: Detection of agglomerates during pellet production
The production of pharmaceutical pellets is typically done by granulation, extrusion with subsequent spheronization or coating. The desired result is a narrow and homogeneous particle size distribution of round particles. In the granulation and coating processes, the formation of agglomerates is an unwanted side effect. Agglomerates can have a negative impact on product properties; they can lead, for example, to changes in the solubility or the release rate of the active ingredients. Therefore, the amount of agglomerates is usually strictly controlled for each product batch. The CAMSIZER is able to detect percentages of agglomerates as low as 0.05 %. Neither laser diffraction nor sieve analysis are suitable methods to reliably detect such minor percentages. Due to the measuring principle laser particle analyzers require a minimum concentration of 2 % to detect agglomerates or undersized particles, such as dust fractions. Smaller amounts may be simply ignored by the software. Particle shape is also an important factor in this context. Elongated particles, for example, can neither be detected with laser diffraction nor with sieve analysis.
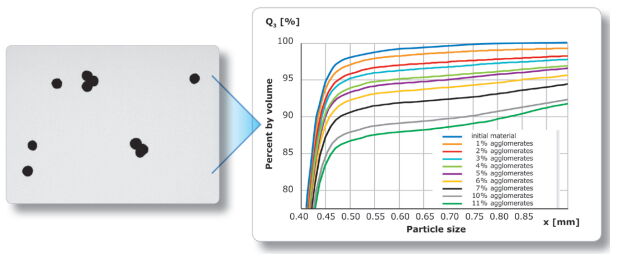
Fig. 4 Reliable detection of oversized agglomerates by the CAMSIZER P4: Approx. 0.21g of agglomerates, which is equal to about 10 particles, have been repeatedly added to a sample of 21 g to achieve mixtures in the range of 1 % to 11 %. The percentage of oversized particles at 0.7 mm exactly matches the calculated mixing percentages.
Example 2: Measuring coating thickness
The various coating steps when producing pellets require precise analysis of the coat thickness of the applied layers. The total dosage of the drug layer is defined by its thickness; the thickness of other functional layers can control the drug release rate and dissolution process. The drug release is inversely proportional to the thickness of the polymer membrane layers, and proportional to the surface area of the particles. With Dynamic Image Analysis it is possible to reliably determine variations in the coating thickness of less than 1 micron. The method combines both high resolution and excellent statistics as a great number of particles is analyzed in a very short time. Sieve analysis, however, only offers low resolution, as typically only very few sieve sizes are available in the narrow size range of coated granules. Traditional microscopebased technologies such as SEM or static light microscopy offer excellent resolution but only for very few particles. [2] [3] [4]
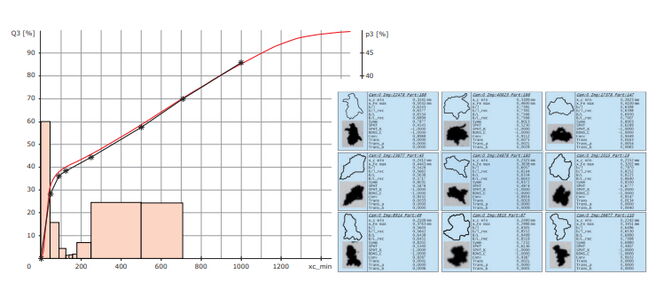
Fig. 5 Particle size distributions after different process steps during coating, ranging from the small nonpareil starting pellets to the final product after polymer coating. The detection of smallest changes in the average particle diameter allows the precise measurement of the coating thickness. The width of the size distributions enables a characterization of the homogeneity of the coating process.
Example 3: Tabletting Mixture
In tableting, the goal is usually to generate a product that has low friability and high tensile strength [5]. By analyzing the size distribution, it is possible to predict the suitability of a mixture for tabletting. The starting products are often granulates with a wide size distribution and irregular particle shape. Both properties contribute to the compactability and have an influence on the mechanical properties of the mixture. This is why dynamic image analysis provides valuable information besides particle size to characterize a bulk material and relate these to its mechanical properties. Note that in the example below the DIA result largely matches those of sieve analysis. Hence, it is possible (and advisable) to replace the inaccurate, low resolution and time-consuming sieving method with a faster, more accurate and highly automated technique. This mixture has a size distribution from 10μm to 1.5 mm and the CAMSIZER X2 DIA analyzer is able to determine the entire distribution without any hardware adjustment. Subsequent examination of individual particles gives a thorough understanding of the material at hand.
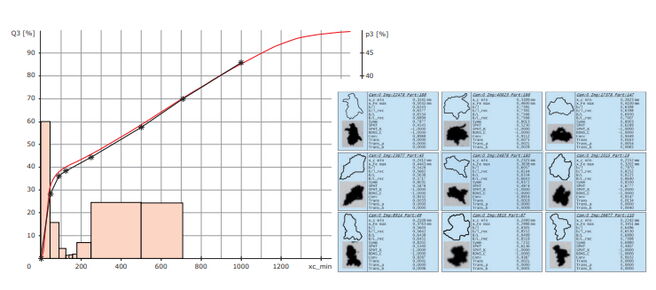
Fig. 6 Size distribution of a tabletting mixture. CAMSIZER X2 analysis (red curve) and sieve analysis (black *) provide comparable results. Some example images on the right show that the particle shape is irregular.
Example 4: Size and shape analysis of starch
Starch is a common excipient in pharmaceutical applications. It comes from various vegetable sources and in various size ranges. The example shows the results of two different starch samples. The distribution is slightly different but the median (d50) value is almost identical. Considering the particle shape, it becomes very clear that sample 1 consists of round, compact grains whereas sample 2 contains a significant amount of fibres!
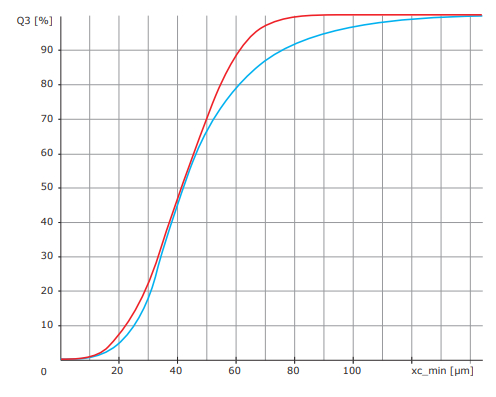
Fig. 7 Size distribution of two starch samples with the CAMSIZER X2. Both distributions have the same median of 41 μm.
A common particle analysis technique is laser diffraction. This method is fast, robust and suitable for routine analysis. Its greatest flaw, however, is the fact that it does not consider the real geometry of the particles but rather relates every measurement signal to the diameter of an equivalent sphere. Thus, it totally neglects particle shape. An additional drawback is that laser diffraction is evaluating a scattering pattern that is simultaneously generated by a collective of particles. Small amounts of oversize and undersize are lost due to the low sensitivity of the method. Fig. 9 shows that the result of laser diffraction analysis correlates with the size definition xarea of the Digital Image Analysis.
Summary
The CAMSIZER P4 is ideal for the measurement of moulding sand. New sand and recycled sand can be characterized with highest accuracy and within a few minutes. This guarantees a high sample throughput, reduced workload and faster response time. The agreement of the results with traditional sieve analysis can easily be established so that all product specifications can remain unchanged. The CAMSIZER P4 can also be equipped with an AutoSampler (Fig. 7) which will allow the consecutive analysis of up to 12 samples. The AutoSampler can also operate in a stand-by mode and start a measurement automatically as soon as a new sample is introduced.
Benefits CAMSIZER P4
- Analysis time 2-3 minutes
- Measuring range 20 μm – 30mm
- Automated analysis
- Results comparable to sieve analysis
- Autosampler available for further automation
- high sample throughput
- excellent reproducibility
- objective, independent of operator
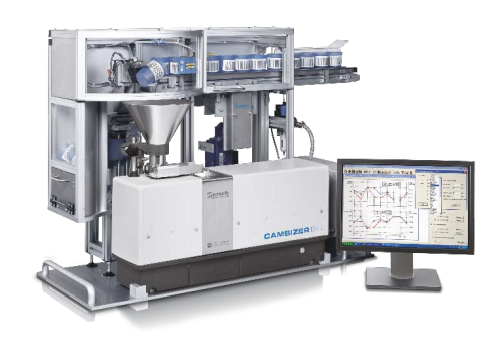
CAMSIZER P4 with AutoSampler
MICROTRAC Producten & Contact
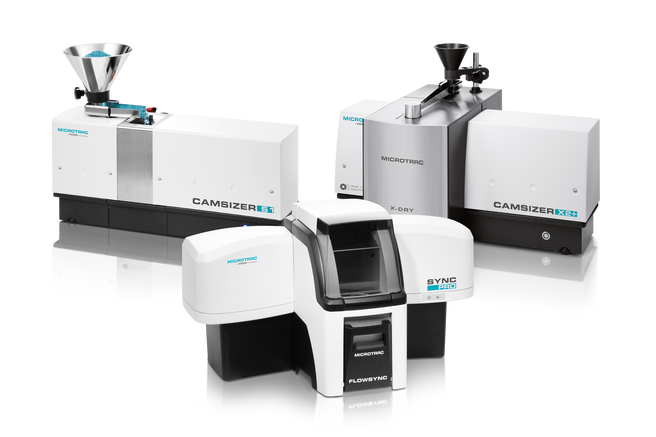
Microtrac offers a wide range of instruments for Dynamic Image Analysis.

Ons team van experts adviseert u graag over uw toepassing en over ons productgamma.