





Dynamic Light Scattering Principle and Particle Size Analysis
Dynamic light scattering (DLS) measures the hydrodynamic diameter of nanoparticles, colloids, emulsion droplets, and macromolecules dispersed in liquids. MICROTRAC, a Verder Scientific brand, applies the technique in NANOTRAC analyzers for laboratory, at-line, and in-line particle size analysis.
0.3 nm–10 µm
Measuring range (particle size); most suitable range 1 nm–2 µm
≈ 2 µL
Minimum sample volume: 1 drop
30–180 s
Recommended minimum measurement duration, depending on particle size
Key figures of dynamic light scattering
| Parameter | Value |
|---|---|
| Measuring range (particle size) | 0.3 nm–10 µm; most suitable range 1 nm–2 µm |
| Sample concentration | From a few ppm to 40 vol% (sample dependent) |
| Minimum sample volume | 1 drop (approximately 2 µL) |
| Measurement time | Recommended minimum duration: 30–180 s, depending on particle size |
| Additional parameters | Primary DLS result: particle size. NANOTRAC-specific functions: particle concentration and molecular weight; zeta potential requires a complementary measurement technique. |
| Standards | ISO 22412 (dynamic light scattering), ISO 13099-2 (zeta potential) |
✓ Heterodyne detection with an optical probe: many samples can be measured at or near their original concentration, reducing or eliminating dilution
✓ Immersion probe for sample volumes from a single drop to a process line (at-line and in-line)
✓ Particle size by DLS, with particle concentration and molecular weight functions available on NANOTRAC analyzers
01 · Measuring principle
Principle of dynamic light scattering
What is dynamic light scattering?
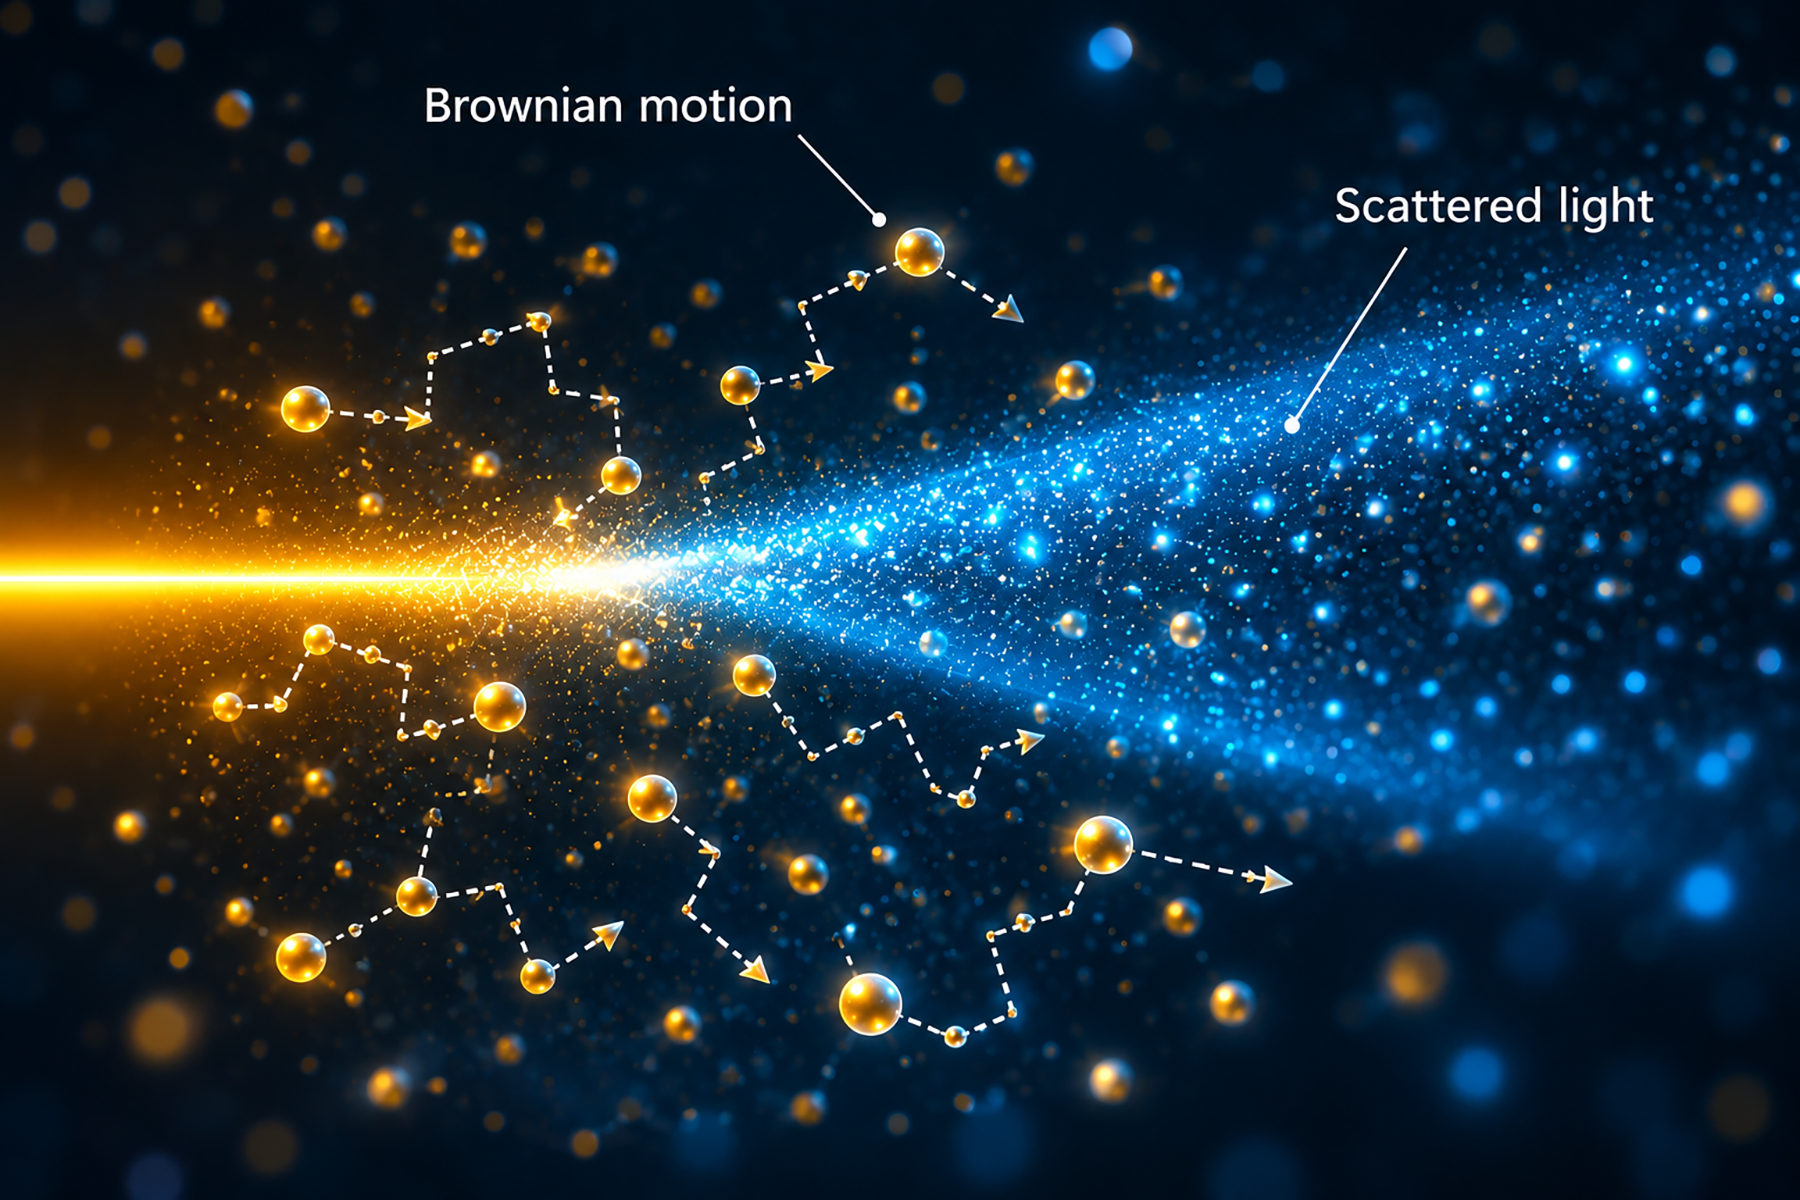
Dynamic light scattering (DLS) is a method for measuring the size of particles dispersed in a liquid. DLS records how fast the particles move by Brownian motion and calculates the hydrodynamic diameter from this speed. Small particles move faster than large particles. The method is described in ISO 22412.
Brownian motion is the random movement of particles caused by collisions with molecules of the surrounding liquid. The diffusion coefficient describes this movement. Dynamic light scattering is particularly suitable for nanoparticles smaller than 100 nm. It also measures colloids, which typically range from 1 nm to 1,000 nm.
How does dynamic light scattering determine particle size?
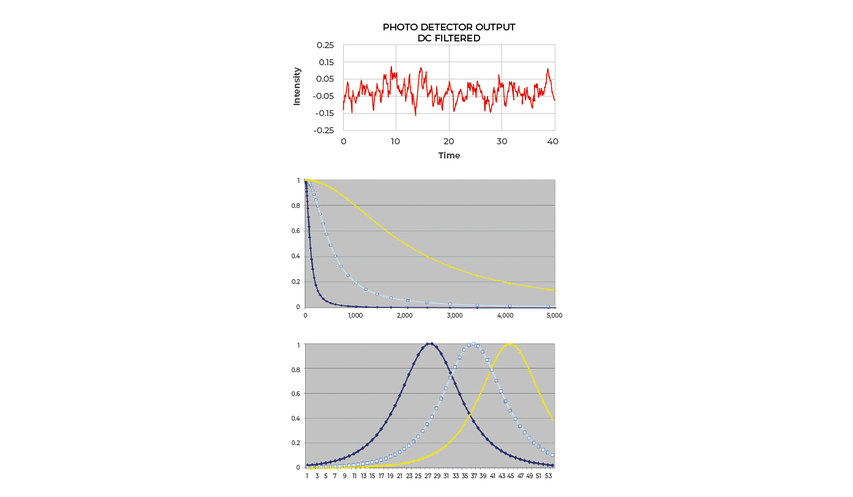
A laser illuminates the sample, and a detector records the light scattered by the particles at a fixed angle. Because the particles move relative to each other, the intensity of the scattered light fluctuates over time. The analysis of these fluctuations gives the diffusion coefficient. The Stokes–Einstein equation converts the diffusion coefficient into the hydrodynamic diameter.
Stokes–Einstein equation
dh Hydrodynamic diameter
η Dynamic viscosity of the dispersion medium in mPa·s
kB Boltzmann constant
D Diffusion coefficient
T Absolute temperature in K
The equation defines three measurement conditions. Temperature must be measured or controlled because the diffusion coefficient increases with temperature. The viscosity of the pure dispersion medium must be known. A viscosity error by a factor of two causes a particle size error by the same factor. Particles must move freely, so the sample must remain at rest and particle interactions must not restrict diffusion. The equation assumes spherical particles in a Newtonian liquid, which applies to most liquids below 20 mPa·s.

02 · Data interpretation
Results of a dynamic light scattering measurement
The primary DLS result is an intensity-weighted particle size distribution of the hydrodynamic diameter. Depending on the analyzer and evaluation method, statistical values, converted distributions, or complementary measurements may also be available.
The hydrodynamic diameter includes solvent molecules and surface layers that move with the particle. It may therefore exceed the geometric diameter from electron microscopy. The values may be similar for compact, approximately spherical particles without substantial solvation layers or surface coatings.
What do z-average and PDI mean?
In PCS, cumulants analysis provides the intensity-weighted z-average and polydispersity index (PDI). The z-average describes the mean hydrodynamic diameter, while PDI indicates the relative distribution width. Cumulants analysis does not provide a particle size distribution.
What is the difference between intensity-, volume-, and number-weighted results?
The intensity-weighted distribution is the primary DLS result. Volume- and number-weighted distributions are derived conversions that require optical and particle-model assumptions and should be interpreted as estimates.
| Result | Definition | Typical use |
|---|---|---|
| Hydrodynamic diameter | Diameter of a sphere with the same diffusion coefficient as the particle | Basis of all DLS results |
| Intensity-weighted distribution | Primary DLS distribution, weighted by scattered-light intensity. The calculation does not require particle refractive index as an input, but detectability depends on optical contrast. | Detection of small amounts of large particles or agglomerates |
| Volume-weighted distribution | Derived from the intensity-weighted result using Mie theory; requires refractive index, transparency, and particle-shape assumptions | Estimated comparison with volume-based results from other methods |
| Number-weighted distribution | Derived conversion from the volume-weighted distribution; uncertainties increase through each transformation | Estimated relative number of particle populations in specific cases |
| Mean diameters and percentiles (D10, D50, D90) | Statistical values of the measured distribution | Quality control, comparison of batches |
| Polydispersity index (PDI) | Dimensionless width parameter obtained with the PCS cumulants method; a smaller value indicates a narrower distribution | Quality control of monomodal samples measured with PCS |
| z-average | Intensity-weighted mean hydrodynamic diameter obtained with the PCS cumulants method; defined in ISO 22412 | Quality control of monomodal samples measured with PCS |
| Particle concentration | NANOTRAC-specific calculation from the loading index, reported in cm³/mL or particles/mL | Concentration of individual size fractions |
| Molecular weight | Complementary static light-scattering measurement using a Debye plot at several concentrations; available on selected NANOTRAC analyzers | Polymers and proteins |
03 · Sample requirements
Suitability of dynamic light scattering
Which samples are suitable, and what affects DLS measurement accuracy?
With MICROTRAC NANOTRAC analyzers, dynamic light scattering is suitable for nanoparticles, colloids, emulsions, polymers, and proteins from 0.3 nm to 10 µm in a liquid of known viscosity. The technique is particularly suited to the nanometer and sub-micron range. Reliable measurement requires a stable dispersion within the instrument's size and concentration range. Dry powders, particles above 10 µm, rapidly changing samples, and particles with insufficient refractive-index contrast require another technique or different sample preparation.
Three practical limits apply: the dispersion medium, the concentration, and the stability of the sample.
Medium Dispersion medium
Liquids with a viscosity of 0.3–3 mPa·s are recommended, including water, ethanol, and isopropanol. Other polar and nonpolar solvents, acids, and bases may be used if they are compatible with 316 stainless steel, sapphire, and polytetrafluoroethylene (PTFE). Higher viscosity lowers the upper size limit from 10 µm in water to approximately 1 µm in a liquid of 10 mPa·s.
Signal Concentration
The concentration must give a sufficient scattering signal without multiple scattering. The loading index of the measurement (see Evaluation of the signal) indicates whether the concentration is within the usable range of 0.1–100.
Time Sample stability
The sample must remain stable during measurement. Three repeat measurements are recommended for known materials and five to ten for unknown samples. A drifting result indicates a change in the sample or its preparation.
Recommended minimum measurement time by particle size
| Particle size | Minimum measurement time |
|---|---|
| <60 nm | 30 s |
| 60–300 nm | 90 s |
| 300–900 nm | 120 s |
| >900 nm | 180 s |
How does dynamic light scattering compare with laser diffraction and other methods?
With MICROTRAC NANOTRAC analyzers, dynamic light scattering is suitable for nanoparticles, colloids, emulsions, polymers, and proteins from 0.3 nm to 10 µm in a liquid of known viscosity. The technique is particularly suited to the nanometer and sub-micron range. Reliable measurement requires a stable dispersion within the instrument's size and concentration range. Dry powders, particles above 10 µm, rapidly changing samples, and particles with insufficient refractive-index contrast require another technique or different sample preparation.
Three practical limits apply: the dispersion medium, the concentration, and the stability of the sample.
| Criterion | Dynamic light scattering (DLS) | Laser diffraction | Dynamic image analysis | Static multiple light scattering (SMLS) |
|---|---|---|---|---|
| Measured quantity | Diffusion coefficient (Brownian motion) | Angular distribution of scattered light | Images of individual particles | Backscattered and transmitted light along the sample height over time |
| Result | Hydrodynamic diameter and distribution | Equivalent spherical diameter, volume-based distribution | Size and shape of each particle | Stability index, migration velocity (no particle size) |
| Measuring range (MICROTRAC) | 0.3 nm–10 µm (NANOTRAC) | 10 nm–4,000 µm (SYNC) | 0.8 µm–8 mm (CAMSIZER X2+) | Applicable to particles of 10 nm–1 mm (TURBISCAN) |
| Sample state | Liquid dispersion at rest, dilute or concentrated | Dilute dispersion in circulation or dry powder | Dry powder or dispersion in flow | Concentrated dispersion, undiluted |
| Shape information | No | No | Yes | No |
| Standard | ISO 22412 | ISO 13320 | ISO 13322-2 | Guidance: ISO/TR 13097 |
Particle tracking analysis (PTA), also known as nanoparticle tracking analysis (NTA), is described in ISO 19430. It records the Brownian motion of individual particles with a camera and reports a number-weighted distribution and number concentration. Samples typically require sufficient dilution to track individual particles, whereas DLS measures the particle ensemble.
04 · Optical design
Heterodyne detection and frequency power spectrum in dynamic light scattering
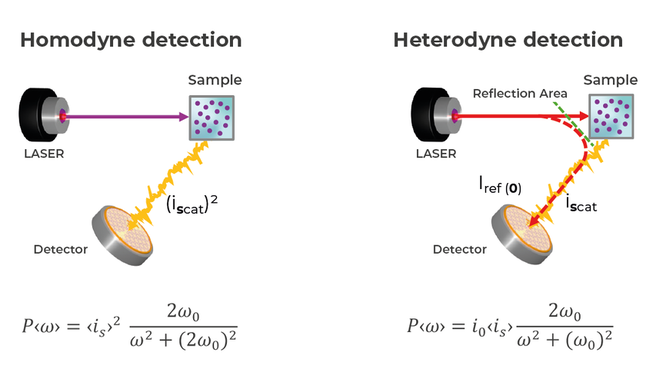
How do heterodyne and homodyne dynamic light scattering differ?
Heterodyne detection

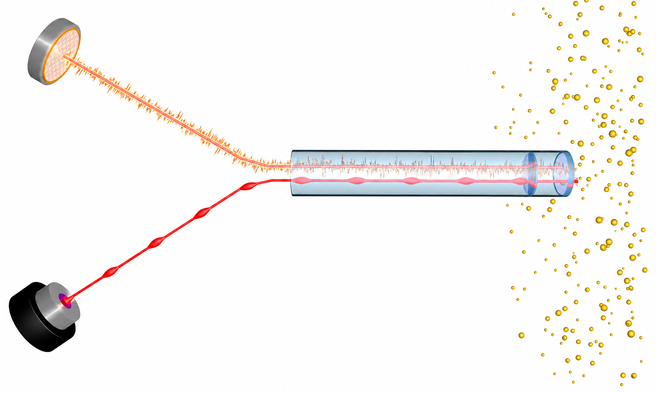
In heterodyne detection, scattered light is superimposed on part of the incident laser light. The signal is proportional to the product of scattered and reference intensity, producing a stronger signal and higher signal-to-noise ratio.
Homodyne detection
In homodyne detection, scattered light serves as its own reference, and the detector signal is proportional to the square of the scattered intensity.
This difference changes the weighting of large and small particles. With heterodyne detection, signal intensity increases with the third power of particle diameter. One 1 µm particle therefore produces the same signal as 1,000 particles of 100 nm. With homodyne detection, signal intensity increases with the sixth power; one 1 µm particle equals 1,000,000 particles of 100 nm. Heterodyne detection reduces the dominance of large particles and improves sensitivity to weakly scattering particles in the lower nanometer range.
MICROTRAC implements heterodyne detection in an optical probe. An optical fiber directs laser light to a sapphire window at the probe tip. The window reflects part of the light to the detector as a reference beam. The remaining light enters the sample, and 180° backscattered light returns through the same fiber and interferes with the reference beam. Measurement occurs within approximately 50 µm of the window. Many concentrated dispersions can therefore be measured without dilution, depending on their optical and rheological properties and loading index.
Dilution changes pH, ionic strength, and surfactant concentration. These changes may alter particle size, agglomeration, and zeta potential. Measuring at or near the original concentration can avoid these effects when sample properties and loading index permit. Fluorescent particles can also be measured because the reference beam, rather than sample light, provides the frequency reference.
Evaluation of the signal: frequency power spectrum and photon correlation spectroscopy
The detector signal can be evaluated with an autocorrelation function, the basis of PCS, or a frequency power spectrum (FPS). FPS converts the signal into a frequency spectrum with a fast Fourier transform (FFT). Each particle size produces a characteristic frequency inversely proportional to its size. MICROTRAC derives the particle size distribution from this spectrum.
On a logarithmic frequency axis, the curves for different particle sizes have the same shape and shift along the axis. Iterative deconvolution derives the distribution without a preset number of modes. The sum of the spectral amplitudes is the loading index, which is proportional to particle concentration.
| Criterion | Frequency power spectrum (FPS) | Photon correlation spectroscopy (PCS) |
|---|---|---|
| Detection | Heterodyne, 180° backscatter | Mostly homodyne; backscatter, 90°, or forward angle |
| Signal processing | Fast Fourier transform into a frequency spectrum | Autocorrelation function |
| Primary result | Particle size distribution by deconvolution | z-average and polydispersity index |
| Size distribution | Derived from the frequency spectrum by iterative deconvolution, with no preset number of modes | Requires a separate distribution algorithm; cumulants analysis provides z-average and PDI, not a particle size distribution |
| Sample concentration | Dilute to concentrated, depending on the sample; optical probe in contact with the dispersion | Instrument- and geometry-dependent; commonly measured in sample cells |