






I toner sono coloranti per processi di stampa elettrostatica. Il toner è una polvere molto fine composta da particelle da 5 a 30 μm. A causa della dimensione notevolmente ridotta delle particelle, la polvere risulta scorrevole e si comporta come un liquido. Il toner è composto da resina sintetica, pigmenti, ossidi metallici magnetizzabili e varie sostanze ausiliarie.
I toner vengono utilizzati principalmente nelle fotocopiatrici e nelle stampanti laser per stampare su carta. Le cartucce di toner laser da utilizzare con fotocopiatrici e stampanti sono disponibili in set di ciano, magenta, giallo e nero (CMYK), e consentono la generazione di un'ampia varietà di colori mediante la miscelazione (Fig. 1).
Le richieste ed esigenze relative ai toner sono specifiche e precise: da un lato devono soddisfare i requisiti per quanto riguarda il risultato di stampa, dall'altro devono aderire a quanti più materiali possibili, ad eccezione del dispositivo stesso (fissaggio rulli). Inoltre, i toner devono essere in grado di soddisfare i requisiti tecnici del dispositivo, non devono accettare l'umidità e devono mantenere la loro consistenza fino al momento dell'utilizzo.
Per garantire tali proprietà, è fondamentale che venga effettuata una caratterizzazione precisa della dimensione e della forma delle particelle con un analizzatore granulometrico appropriato.
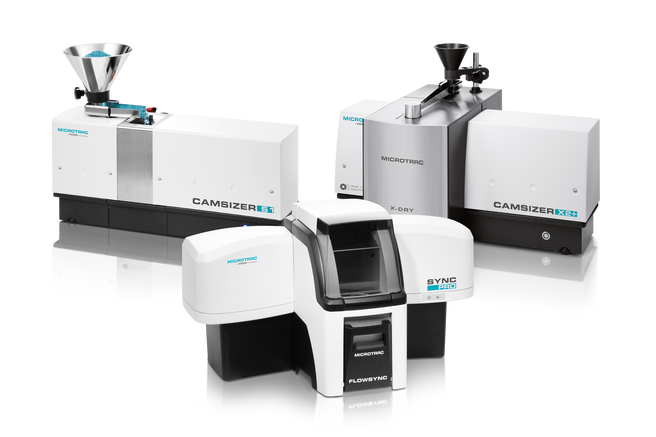
Microtrac offre un'ampia gamma di strumenti per l'Analisi d'Immagine Dinamica.
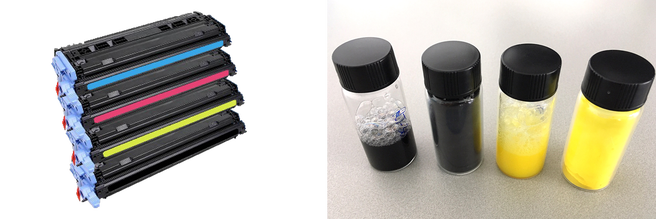
Figura 1:
Left: Typical toner cartridges for use in laser printers. Right: Toner samples submitted for analysis in a Microtrac laboratory, from left to right: black liquid, black powder, yellow liquid and yellow powder.
Soluzione Static Image Analysis with the CAMSIZER M1
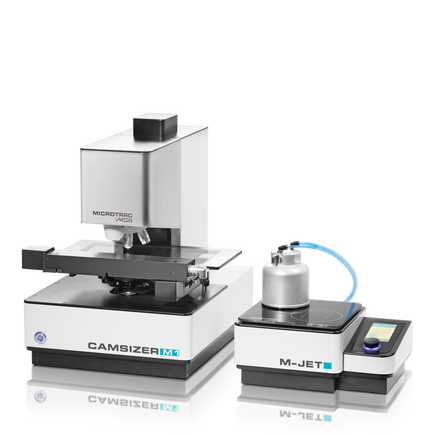
CAMSIZER M1 utilizza il principio di misurazione dell'analisi statica delle immagini (Static Image Analysis) per determinare la dimensione e la forma delle particelle in un intervallo da 0,5 μm a 1500 μm. La base dell'analizzatore consiste in un potente microscopio il cui hardware e software sono ottimizzati per l'analisi automatizzata delle particelle.
Per l'analisi dell'immagine statica (secondo ISO 13322-1) il campione deve essere posizionato su un vetrino o un altro supporto e spostato da un vassoio automatico per essere fotografato passo dopo passo da una fotocamera da 18,1 Megapixel. Il campione rimane statico durante l'acquisizione dell'immagine, il che garantisce immagini di alta qualità e ricchezza di dettagli.
I sei diversi ingrandimenti e il preciso piano di campionamento con una precisione di posizione <3 μm garantiscono condizioni di misurazione ottimali sull'intero intervallo di misurazione. I risultati vengono visualizzati come distribuzioni granulometriche e della forma con una varietà di parametri configurabili di misurazione. Il software Particle X-Plorer consente la successiva visualizzazione ed analisi di ogni singola particella registrata.
For the sample preparation of dry powders, such as toner particles, the M-Jet module is available, see Fig. 2 on the right.
Sample Preparation
Black toner and yellow toner, both as powder and as suspension have been submitted for analysis (four samples altogether, Fig. 1, right). As preparation for the analysis the two suspensions, two drops each were placed on a slide and covered with a coverslip. For the undiluted samples, about 10% of the image area was covered by the particles, as a result of which many overlays were detected (Fig 3, left). The samples were therefore diluted until a covered area of 0.5 - 1% was reached. For the diluted samples, almost all particles are well separated from each other, the effect of the overlays can therefore be neglected (Fig. 3, right). The two powder-like toner samples have been dispersed on a glass slide with the M-Jet module (70 kPa pressure).
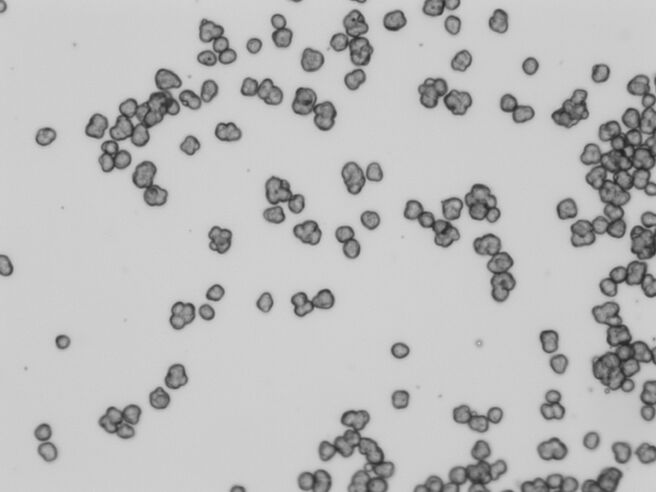
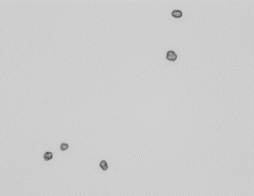
Figura 3:
Left: Toner particles in liquid, original concentration -> many agglomerates. Right: Toner particles in liquid, diluted -> particles separated. CAMSIZER M1 images, 20 x magnification
The toner particle samples were measured with the CAMSIZER M1 with the size definitions xc min (width), x area (circle equivalent diameter) and xFe max (length). Simultaneously the shape of particles is detected. The instrument was set up for transmitted light and 20 x magnification. Additional tests have been made with 50 x magnification. A detailed description of the size and shape definitions can be found in the appendix.
| Analysis Time | Number of Particles | Field Size | Number of Images | |
|---|---|---|---|---|
| Yellow Liquid | 7 min 24 s | 17 737 | 15.0 x 8.8 | 1017 |
| Black Liquid | 7 min 0 s | 11 697 | 12.1 x 10.3 | 961 |
| Yellow Dry | 16 min 9 s | 41 373 | 17.1 x 18.5 | 2426 |
| Black Dry | 27 min 14 s | 30 603 | 16.3 x 35.1 | 4384 |
Tavola 1:
Typical measurement conditions for toner particle samples wet / dry at 20 x magnification.
Risultati
In the following diagrams the size distribution is expressed by:
- Cumulative distribution Q3
- Frequency distribution q3
20 x or 50 x magnification?
Fig. 4 shows a comparison between analysis at 20 x and 50 x magnification. The results are almost identical. Therefore, it is reasonable to measure with the lower magnification because this results in significantly shorter analysis time.
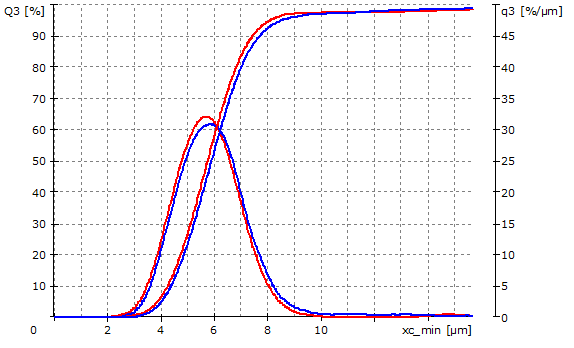
Figura 4:
Graphs of the black dry toner particles sample, size definition X c min. with 20 x (red) and 50 x magnification (blue).
Repeatability
The yellow liquid sample has been measured three times (Fig. 5). The repeatability of the results is excellent.
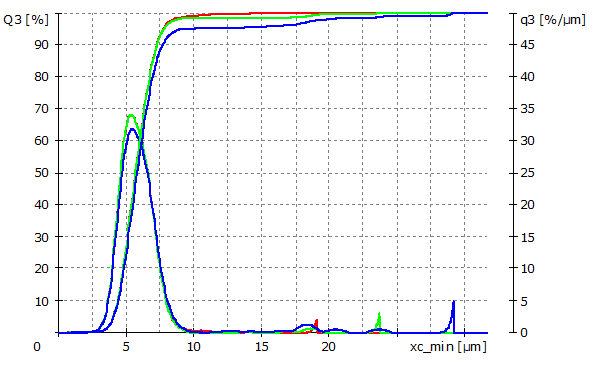
Figura 5:
Three consecutive measurements of the yellow toner liquid sample. Size definition xc min with magnification 20 x. First measurement: red curve, second measurement: green curve, third measurement: blue curve. Some agglomerates appear as the measurements proceed and the toner sample slowly dries (oversize particles in the third measurement).
Dry samples
Fig. 6 shows a comparison of the size distribution for the two dry powders. The black powder is slightly larger than the yellow powder.
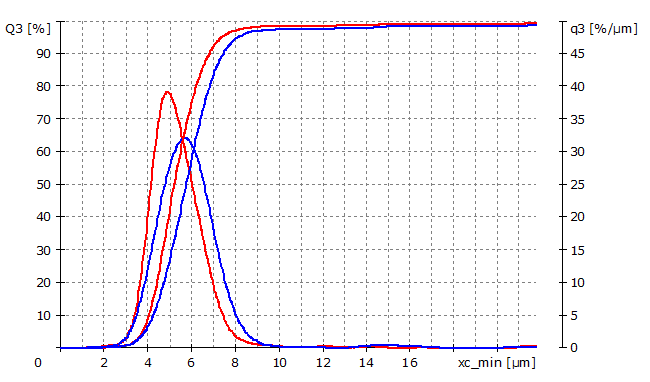
Figura 6:
Graphs of dry yellow toner particles sample (red) and dry black toner particles sample (blue) size definition x c min.
Liquid samples
Fig. 7 shows a comparison of the size distribution for the two dry powders. Again, the black powder is slightly larger than the yellow powder.
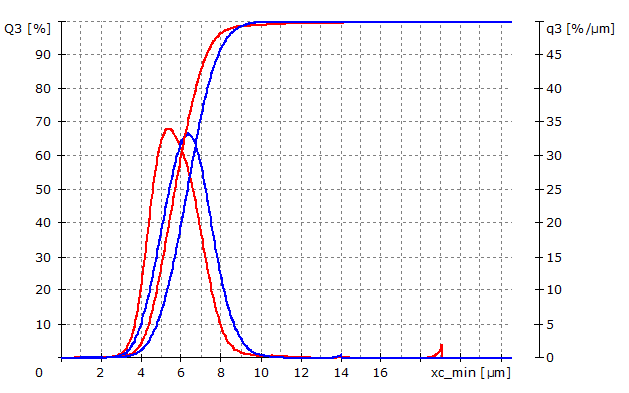
Figura 7:
Graphs of the liquid toner samples, size definition x c min. 20 x magnification. Yellow toner liquid sample (red) and black toner liquid sample (blue)
Particle Size results: Overview
Table 2 shows the percentiles of the Q3 distribution at 10 %, 50% and 90 % (d10, d50, d90) for all three size definitions xc min, xarea and xFe max
The results for the wet and dry measurement of each color are almost identical. It is therefore possible to measure toner in wet or dry mode. However, the concentration of the liquid must not be too high. Dry sample preparation with the M-Jet works equally well as a wet dispersion.
| xc min | Yellow Liquid | Black Liquid | Yellow Dry | Black Dry |
|---|---|---|---|---|
| D10 [µm] | 4.37 | 4.78 | 4.05 | 4.25 |
| D50 [µm] | 5.69 | 6.31 | 5.21 | 5.75 |
| D90 [µm] | 7.27 | 7.85 | 6.79 | 7.44 |
| xarea | Yellow Liquid | Black Liquid | Yellow Dry | Black Dry |
|---|---|---|---|---|
| D10 [µm] | 4.88 | 5.45 | 4.55 | 5.09 |
| D50 [µm] | 6.29 | 7.03 | 5.85 | 5.58 |
| D90 [µm] | 7.78 | 8.47 | 7.59 | 8.17 |
| xFe max | Yellow Liquid | Black Liquid | Yellow Dry | Black Dry |
|---|---|---|---|---|
| D10 [µm] | 5.09 | 5.99 | 4.70 | 5.73 |
| D50 [µm] | 6.98 | 7.91 | 6.55 | 7.61 |
| D90 [µm] | 8.81 | 9.80 | 9.12 | 9.76 |
Tavola 2:
d10, d50 and d90 of all four samples, 20 x magnification, size definition x c min, x area and x Fe max
Comparison with Laser Diffraction
Laser diffraction is an established method to measure the particle size distribution in a range from below 100 nm up to 2 mm. It is a very versatile technique, however, the reported size is always based on a sphere model, no information about shape, length or width of the particles is available.
Resolution, sensitivity and accuracy are better for image analysis. Fig. 8 shows a comparison between CAMSIZER M1 xc min, xarea and xFe max with a laser diffraction result. The Q3 curve from laser diffraction is between xcmin and xFe max and wider than xarea. This is very typical for the correlation between laser and image analysis.
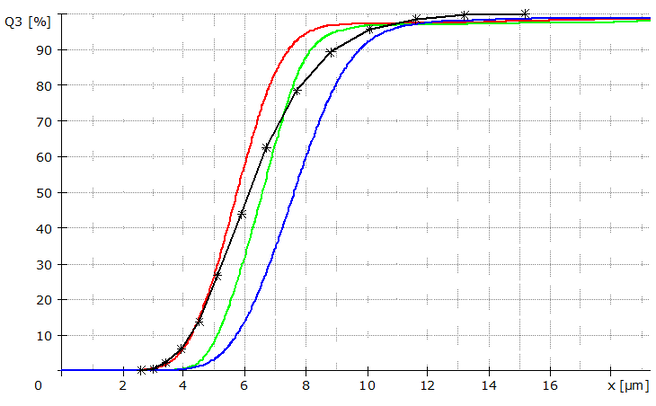
Figura 8:
Graphs of dry black toner sample CAMSIZER M1, x c min (red), x area (green) and x Fe max (blue) and laser diffraction (black *). The distribution obtained from laser diffraction is wider than the CAMSIZER M1 result. Laser diffraction calculates particle size based on a sphere model. The result is therefore between the width and length measurement of the CAMSIZER M1.
Particle Shape Analysis
Simultaneously with the size measurement, the CAMSIZER M1 detects particle shape. The result of the shape analysis can be presented as a cumulative distribution (Q3). Round, isometric or spherical particles will plot on the right side of the diagram, more elongated, angular or non-spherical particles plot on the left side. Fig. 9 and 10 show the aspect ratio and the roundness of a yellow and black toner sample as Q3 distribution. Shape analysis reveals that the yellow toner is more spherical than the black toner.
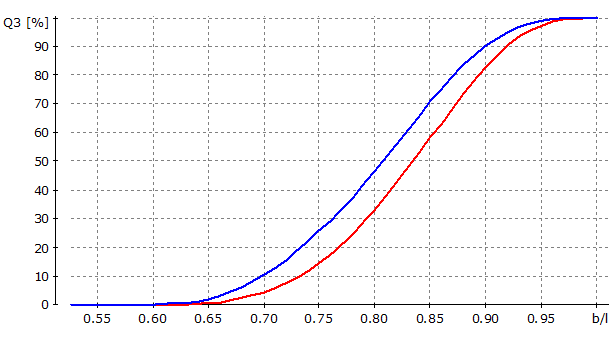
Figura 9:
Shape graphs of the yellow liquid toner (red) and black liquid toner (blue). Shape parameter aspect ratio (b/l); Xc min divided by xFe max.

Figura 10:
Shape graphs of yellow liquid toner (red) and black liquid toner (blue). Shape parameter roundness (RDNS_C).
Toner Particles Evaluation
All particle images acquired during the measurement are saved and can be used for later evaluation. The Particle X-Plorer software offers many possibilities to evaluate images or individual particles. Filter options are available to browse for particles with selected characteristics. In the following, particle examples of both toner samples are presented. Note that all relevant particle size and particle shape data is displayed right next to the according image.

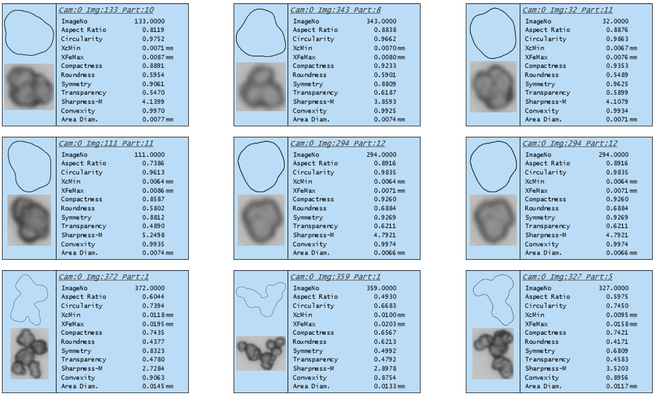
Figura 11:
Example images of the yellow liquid toner sample. All relevant data is displayed next to the particle image. Agglomerates (bottom row) can be easily identified by the low circularity or convexity of the particle. If required, these may be excluded from the evaluation.
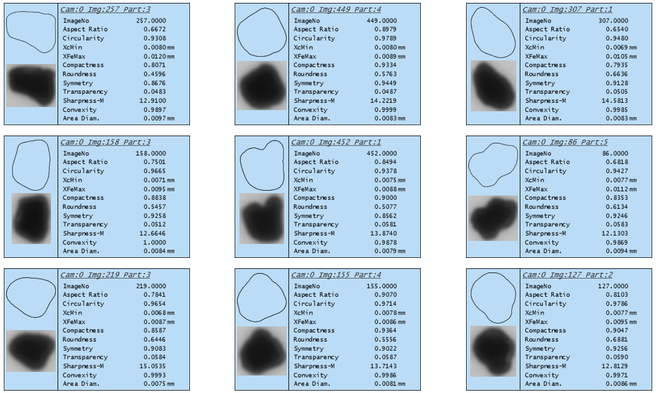
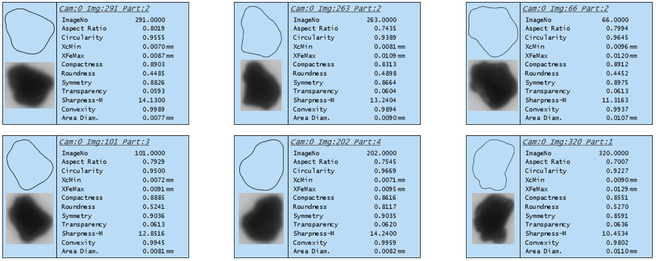
Figura 12:
Example particles of the black liquid toner sample.
Riepilogo
L'analisi delle dimensioni delle particelle e l'analisi della forma delle particelle di tutti e quattro i campioni di toner sono state eseguite con l'analizzatore di immagini statiche CAMSIZER M1. I campioni liquidi sono stati diluiti (2-3 gocce in 20 ml di acqua deionizzata). Le polveri secche sono state disperse su un vetrino con il modulo di dispersione M-Jet. La mediana è compresa tra 5,21 μm e 6,31 μm e le particelle di toner giallo sono leggermente più piccole delle particelle di toner nero.
Gli agglomerati possono essere ignorati dalla misurazione utilizzando un filtro di forma basato sul parametro convessità (convessità particelle <0,97 ignorata). La ripetibilità è eccellente, come mostrato in Fig 5. I risultati possono essere confermati dall'analisi mediante diffrazione laser (Fig. 8). L'analisi della forma delle particelle rivela che le particelle di toner giallo sono più compatte, hanno una maggiore rotondità e un rapporto di aspetto più elevato rispetto alle particelle di toner nero. Un ingrandimento di 20 x è sufficiente per caratterizzare le particelle di toner. La misurazione a 50 ingrandimenti è possibile ma porterà a tempi di misurazione più lunghi se viene analizzato lo stesso numero di particelle.
Appendix: CAMSIZER M1 particle size and particle shape parameters
The diagrams below show the most frequently used particle size and shape definitions used in image analysis with CAMSIZER systems.
xc min
"Width"
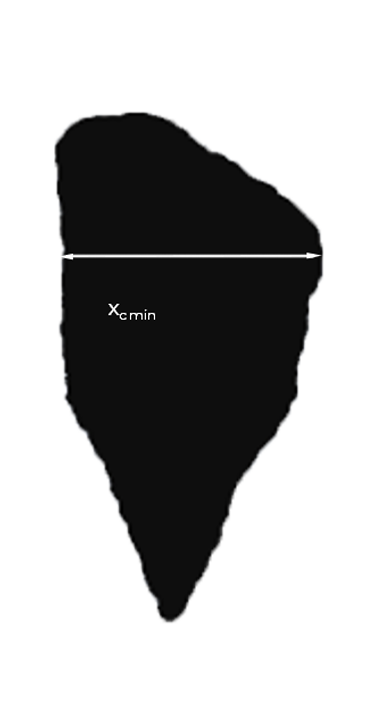
Best suited for sieve correlation
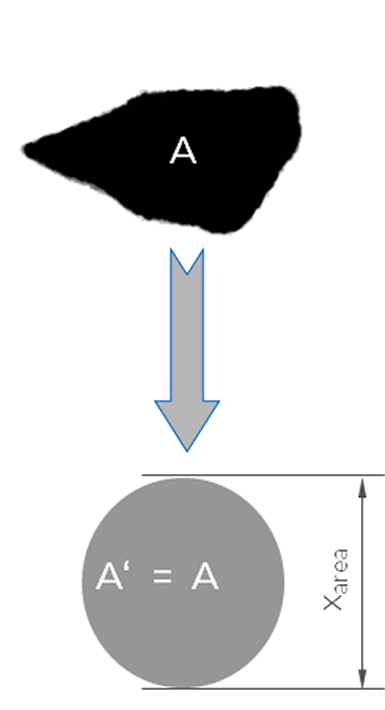
xarea
"Diameter of circle with same projection area"
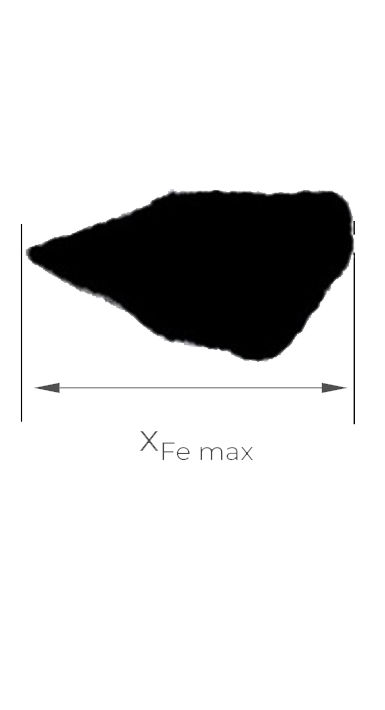
xFe max
"Length"

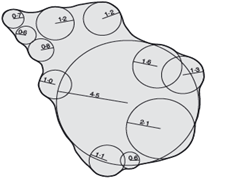
Roundness RDNS_C means radius of the corners divided by the radius of the inner circle
MICROTRAC Prodotti & Contatto
Microtrac offre un'ampia gamma di strumenti per l'Analisi d'Immagine Dinamica.

Il nostro team di esperti sarà lieto di darvi consigli sulla vostra specifica applicazione e sulla nostra ampia gamma di prodotti.